
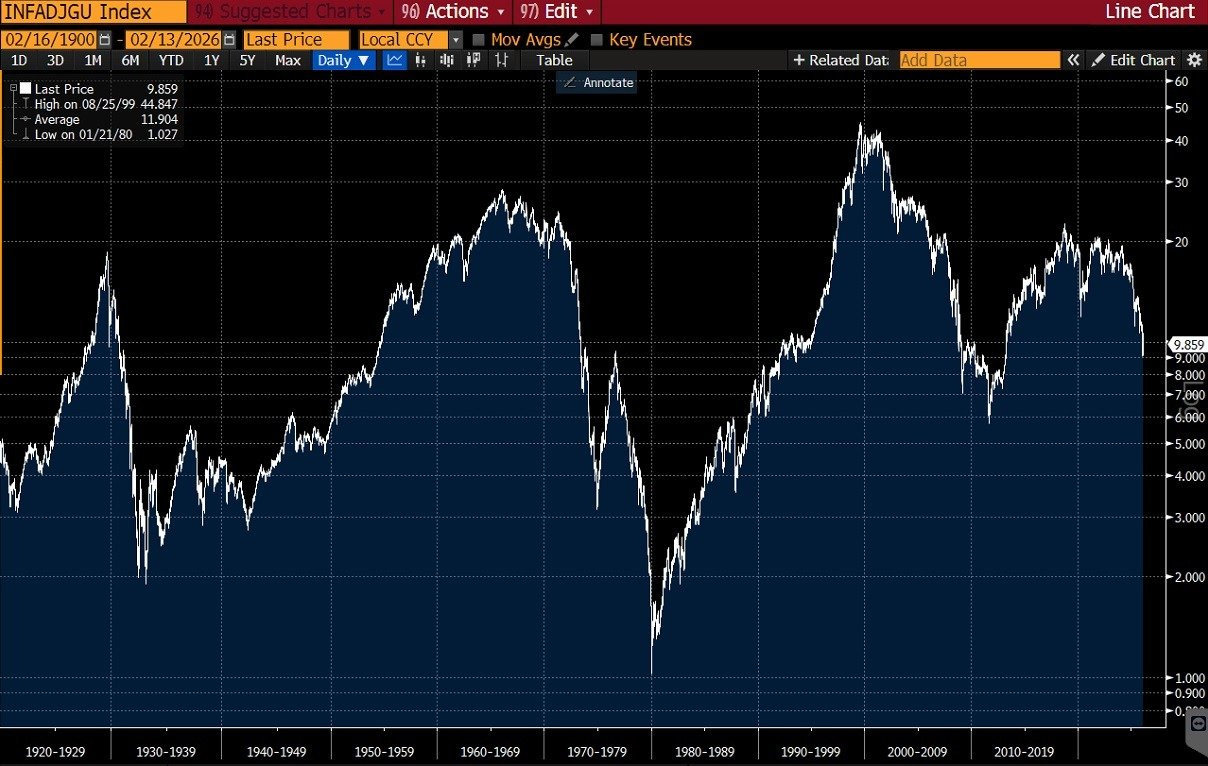
From today’s levels, a 10x move in silver sounds extreme. History says it is normal when two key ratios flip from one extreme to the other at the same time: the Dow priced in gold, and the gold-silver ratio. Even with conservative targets, the math takes silver above $1,000.
Dow/Gold ratio = Dow Jones Index level ÷ gold price
Gold-silver ratio = gold price ÷ silver price.
The Dow/Gold Indicator
The Dow priced in gold compresses a century of market psychology into one line. Extreme optimism peaked in 1929, 1966, and 1999. Extreme pessimism followed, with troughs in 1933 and 1980. The market now sits at another level that historically marks the start of the next downswing in this ratio.
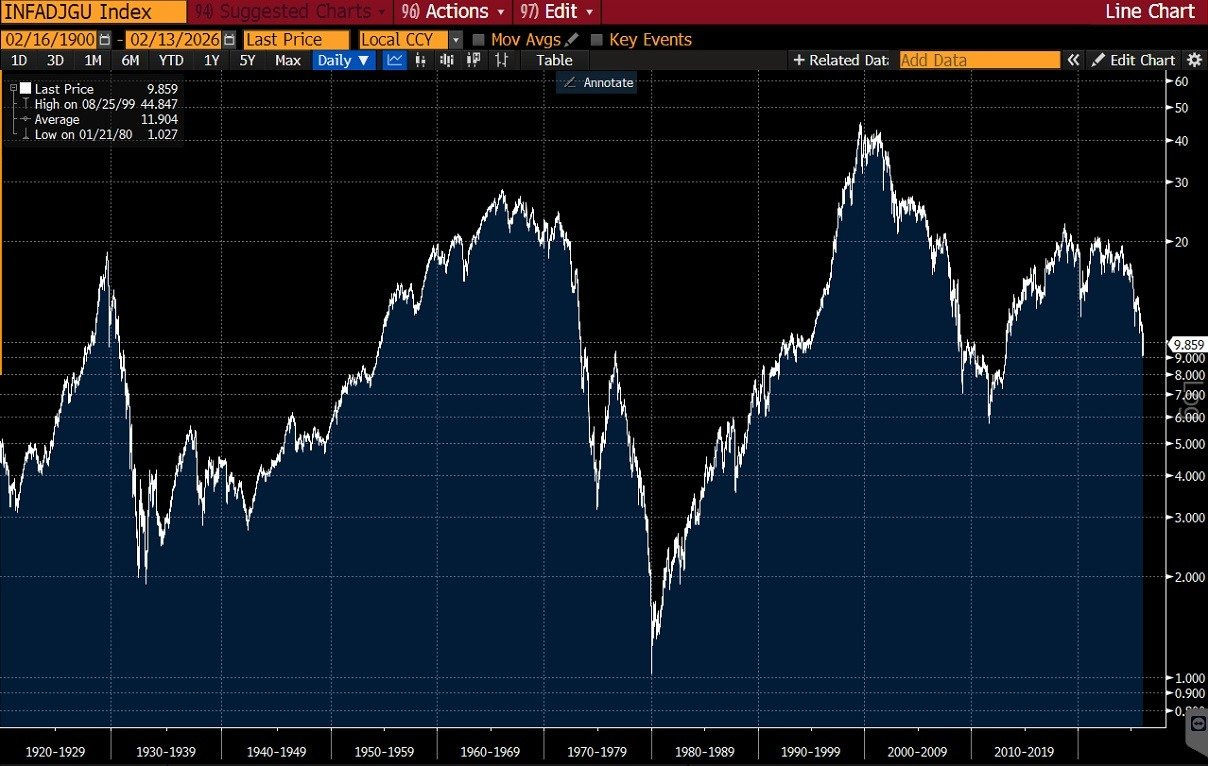
Dow/Gold ratio chart (Dow Jones in gold ounces), 1900–2026: stock market vs gold valuation cycles, major peaks (1929, 1966, 1999) and bottoms (1933, 1980).
I don’t think the real bottom in the Dow/Gold ratio was set in 2011. After 2011, global debt exploded. In past cycles, the Dow/Gold trough coincided with debt becoming manageable again. In the 1930s, debt burdens fell through deflation. In the 1970s, they fell because inflation destroyed the real value of debt.
So where does the Dow/Gold ratio go this time? I expect it to move closer to the 1 level of 1980 than the 2 level of 1933. In the 1930s the world operated under a gold standard. After 1971, gold was free to reprice. Two forces are stronger than one.
I still use 2.5 as my target because I want the middle of the move, not the perfect bottom. Timing tops and bottoms increases risk. Focusing on the middle reduces it. Today the Dow/Gold ratio is 9.82. A decline to 2.5 means the ratio falls by a factor of 9.82 / 2.5 = 3.93. If the Dow stays flat, gold must rise by the same factor.
That implies a gold price of $19,800 ($5,042*3.92), assuming the Dow holds around 49,501. I also assume the Dow is not cut in half by the end of a precious-metals bull market. The 1970s support this: the equity market’s low came earlier, in 1973, while precious metals peaked later.
The $1,000 Silver Roadmap
The second indicator is the gold-silver ratio. Silver is a much smaller market than gold, which is why it moves harder in both directions. In 1980, the gold-silver ratio bottomed at 14. I use 19 to stay conservative and focus on the middle of the move.
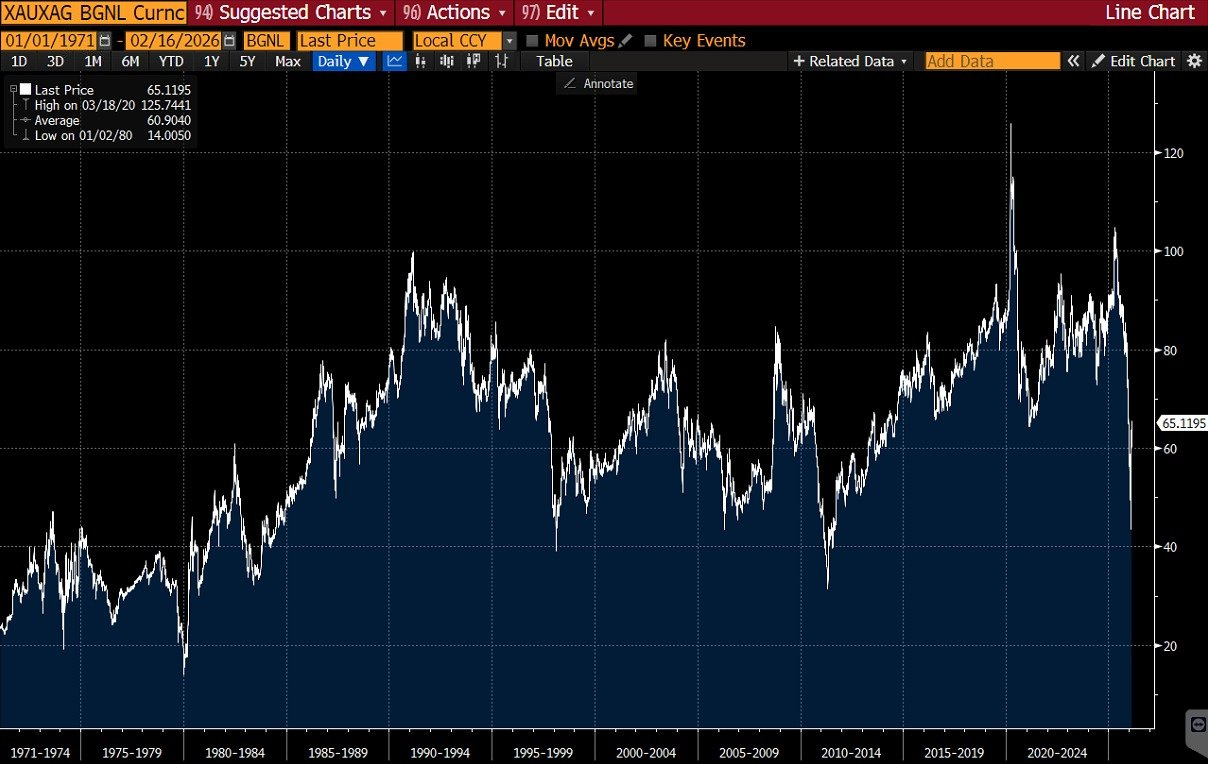
Gold-silver ratio chart (gold vs silver price ratio), 1971–2026: historical extremes, 1980 low near 14, and recent elevated levels impacting silver price outlook.
With gold at $19,800 and a gold-silver ratio of 19, silver prices at $1,042 because $19,800 / 19 = $1,042.
Today’s starting point is clear: gold at $5,042, silver at $77.42, and a gold-silver ratio of 65.13. A move to 19 is not “normalization.” It is a swing from one extreme to the other, and that is exactly how silver reaches four digits.

Timing: 2030–2033
The big question is when silver breaks above $1,000. This cycle already resembles the 1970s: today’s Dow/Gold ratio matches the zone seen in 1973–1976, while the peak arrived in 1980. That pattern implies 4 to 7 years, which puts the timeline in 2030–2033.
Two ratios, one conclusion: silver’s upside is the mathematical consequence of a full-cycle reversal.
Article originally appeared here:
About the author
Karel Mercx is a Dutch multi-asset investment specialist and portfolio manager based in Amsterdam, active in markets since 2000. He manages diversified portfolios, writes about global macro and commodities, and regularly shares investment insights on X and LinkedIn
end of segment
-
our opinions are not our sponsors opinions
-
the editorial department is separate from the promotions department
-
not financial advice