
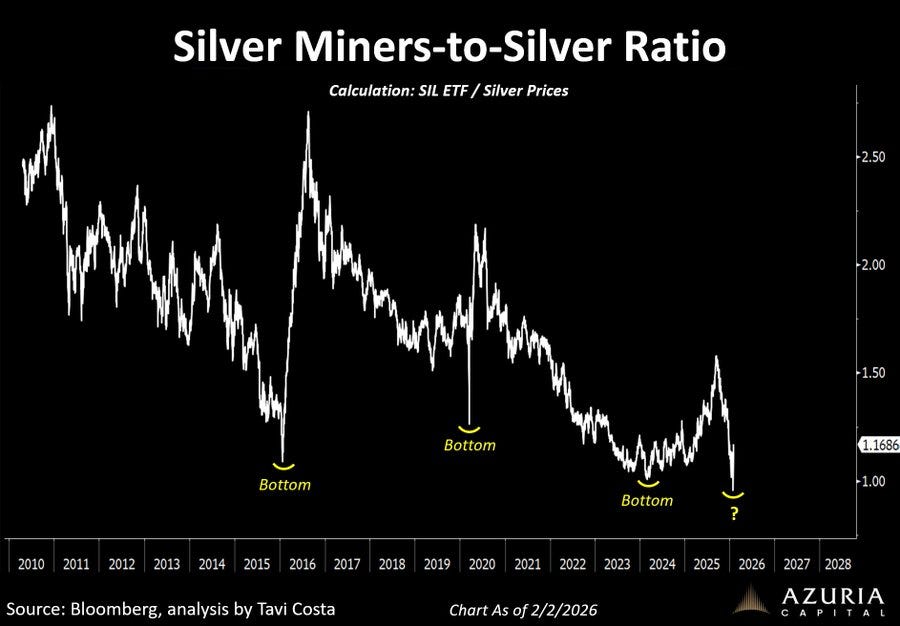
Tavi Costa writes,
”The silver miners-to-silver ratio is currently at one of its lowest levels in history. Not long ago, investors were dreaming of silver trading above $50/oz. Today, with prices well above that level, some producers are operating at sub-$15/oz costs. These are the mining industry’s equivalent of tech- or software-like margins. What a moment to deploy capital, even as the market remains distracted by volatility. Game on.”
The silver miners-to-silver ratio is sitting near historic lows, even after silver’s face-ripping move into late 2025 and early 2026.
Not long ago, everyone was fantasizing about $50 silver. Now we’re trading well above that, yet top-tier producers like Aya Gold & Silver (TSX: AYA, OTCQX: AYASF).are still guiding to mid-teens cash costs per ounce, effectively capturing tech-like operating margins.
Here’s the catch: the market has not yet seen a full earnings season that reflects this new reality. Most miners are still priced off a world where silver averaged closer to $30–40/oz, not the late-2025 spike toward record highs. The tape hasn’t truly digested what $60–70 silver does to free cash flow, balance sheets, and buyback/dividend potential.
That disconnect is the opportunity. While algos chase day-to-day volatility, patient capital can step into premier names before updated financials force a violent repricing.
Explaining leverage.
Let’s say you are investing in your favored Silver miner
Assuming 10,000,000 oz mined each month
Monthly cash flow formula (ignoring taxes/SG&A):
Cash flow = (Price – 17) × 10,000,000
-
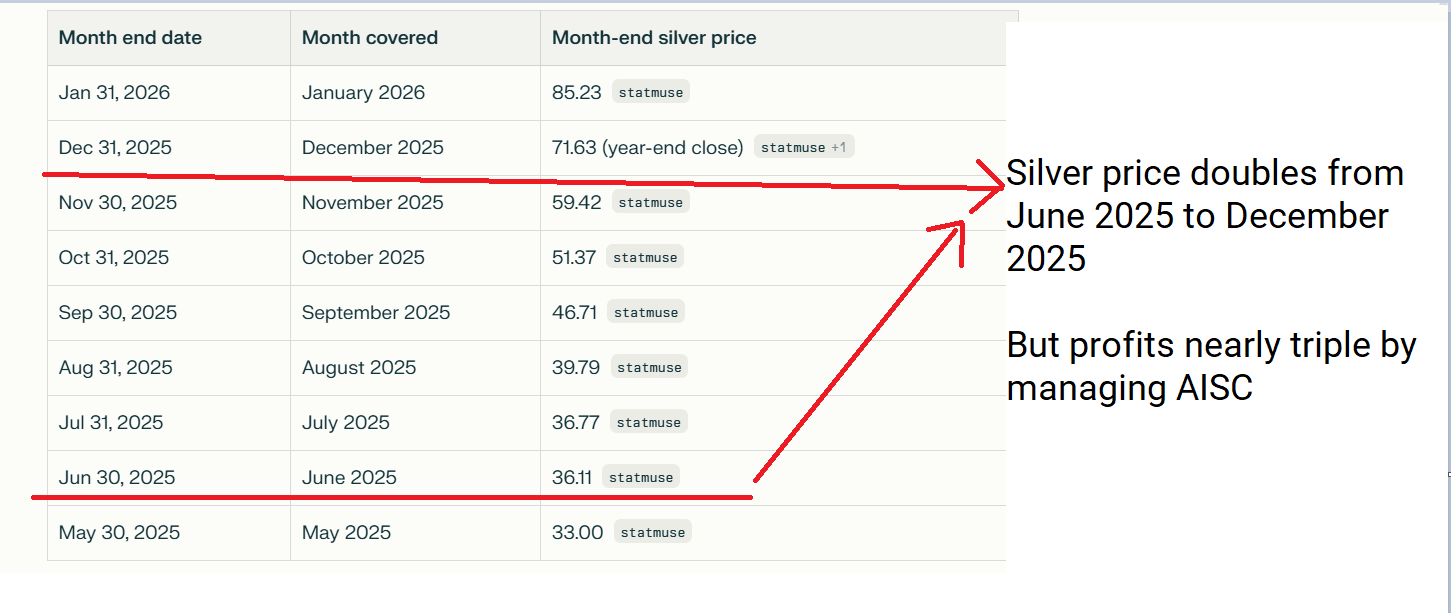
at AISC = $17/oz, using the month‑end prices we listed below
-
Silver roughly doubled from June’s ending price of $36.11 to December’s $71.63 close.
-
but profit per ounce rose from $19.11 to $54.63
-
Prices may have doubled but profits are almost 3× because costs stayed fixed at $17.
-
in this hypothetical, with 10 million ounces, that operating leverage turns a 2× price move into nearly 3× cash flow ($191.1M vs $546.3M).
end of segment and on to our next daily topic
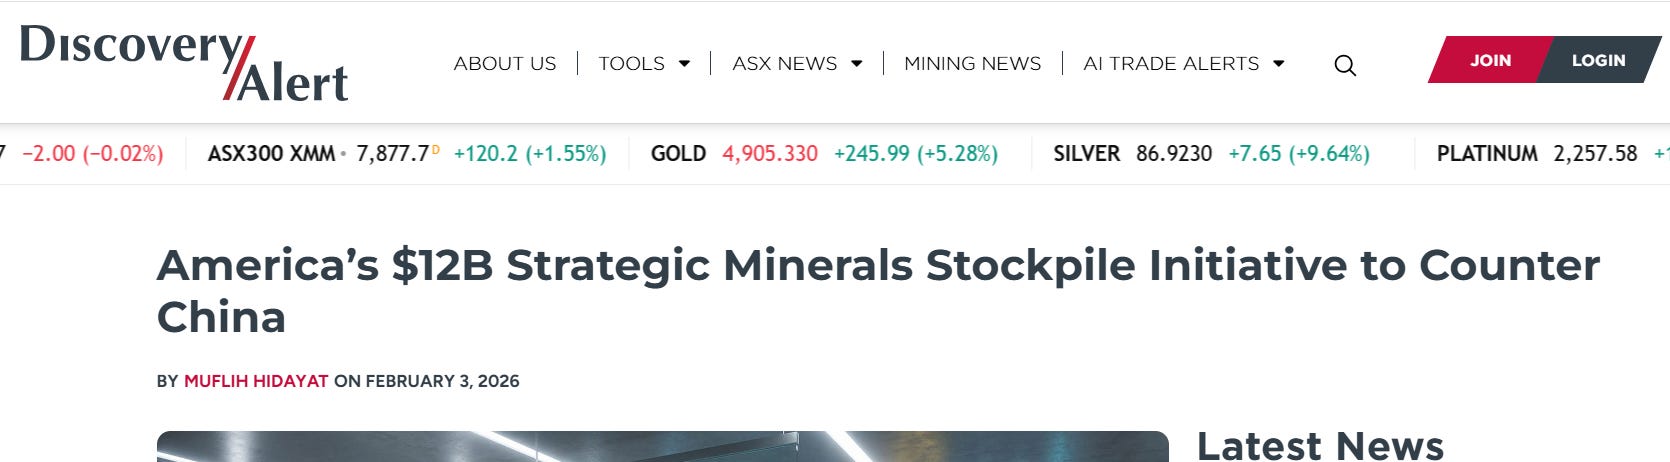
The Nothing Burger that somehow turned into a headline recently
A Measly 12 billion stands out as “too little, too late”, Compared to daily interest payments of 4 billion. This is equal to 3 days of interest payments
Lets investigate the math in detail
-
Annual interest: 39 trillion×3.6%=39×0.036=1.404 trillion dollars per year.
-
Rounded, that is about 1.4 trillion dollars in interest every year on the debt stock alone.
-
Daily burn rate: 1.404 trillion÷365≈3.85 billion, i.e., roughly 4 billion dollars every single day in interest
So sad, so Pathetic , Really
A 39 trillion dollar debt at roughly 3.6% Fed funds implies about 1.4 trillion a year in interest — almost 4 billion every single day just to stand still.
“Project VAULT” is a photo-op stockpile of shiny rocks slapped on top of a metastasizing fiscal tumor. You don’t fix a burning balance sheet with a press release and a warehouse key; you fix it by not detonating the nation’s credit card in the first place. This isn’t strategy — it’s last-minute window dressing on a bankrupt empire
end of segment
-
our opinions are not our sponsors
-
the editorial department is separate from the promotions department
-
not financial advice