
Foreword:
The clock has run out on complacency: the global silver market is entering its terminal phase. The U.S. Mint has already frozen silver sales, signaling that the premier sovereign issuer can no longer confidently source, price, and deliver the metal that underpins monetary trust. One by one, other mints and refiners will stall, starved of planchets and raw supply. Dealers are already slipping from “in stock” to multi‑month delays, the prelude to outright disappearance of inventory.
Soon, the “buy” button will vanish — not because silver is expensive, but because it is simply unavailable. When futures markets are forced into cash settlement and the paper illusion dies, only private holders will possess real metal. They bought in the teens, twenties, fifties, even higher — and they will not part with it at 100, 200, or 250. At that point silver will no longer be an investment; it will be survival‑grade money.
Why Silver at $500 Isn’t Crazy – and Why We’re Still Early
In the financial world, few figures command the kind of credibility Michael Oliver has built over five decades. He started in financial modeling at EF Hutton in 1975 and launched Momentum Structural Analysis (MSA) in 1992, initially catering to institutional investors. Only in 2015 did he open his subscription service to retail audiences — just in time for one of the most misunderstood commodity bull markets in a century.
Oliver’s core idea is deceptively simple: momentum breaks before price. By converting price into a momentum oscillator, he identifies where energy in the market is building or decaying — long before those signals become visible in standard price charts. In essence, he treats momentum as its own structure with support, resistance, and breakout levels. In his experience, those “momentum structures” crack open first, then price follows — often explosively.
The Bigger Context — Gold’s Unfinished Bull Market
To set the stage, Oliver starts with gold. He compares the current bull cycle to past ones that delivered roughly eightfold gains: from $100 in 1976 to $850 in 1980, and again from $250 in 2001 to just under $1,900 a decade later. The latest cycle began from a similar $1,050 low in late 2015 — meaning gold has “only” risen about fourfold so far. If history rhymes, the gold market still has room to double again, implying $8,000–$8,500 as a conservative target.
That number matters for silver, because silver’s performance is typically leveraged relative to gold’s trajectory. If gold doubles, silver can triple or quadruple, especially once the market breaks free from long-entrenched psychological levels.
A New Regime in Silver
When silver blew past $90 last year, even seasoned investors cried “bubble.” Oliver’s response was blunt: this is what acceleration looks like. For nearly half a century, silver’s ceiling between $40 and $50 acted like a dam. But once that wall gave way in mid-2025, momentum analysis showed a historic regime shift — similar to silver’s takeoffs in 1979 and 2010. Both times, silver multiplied sharply within months.
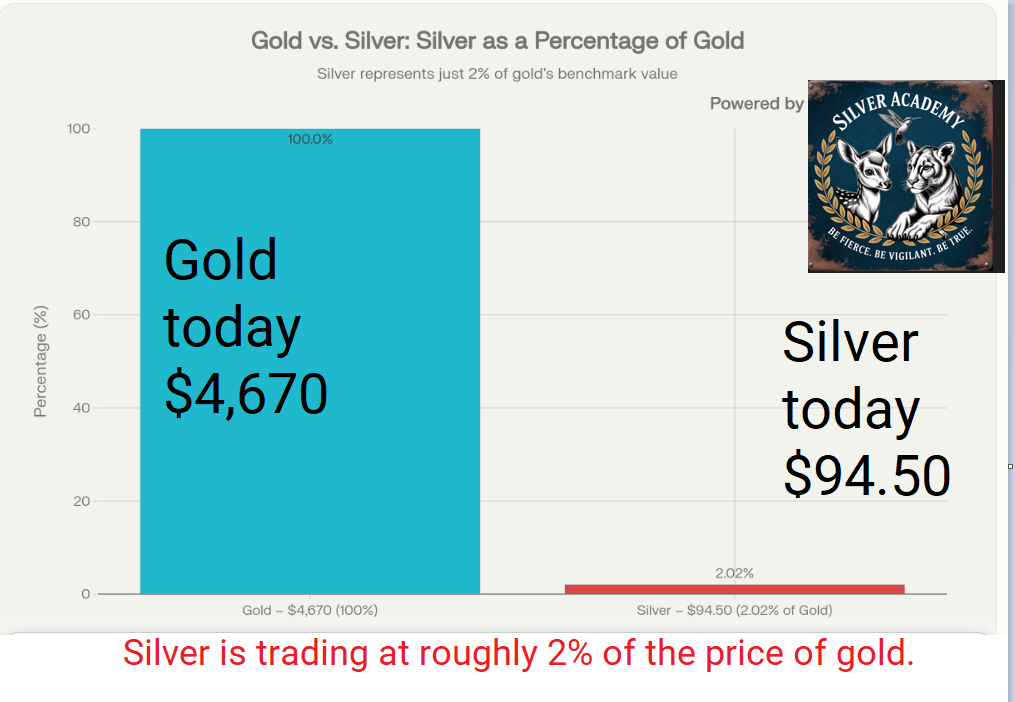
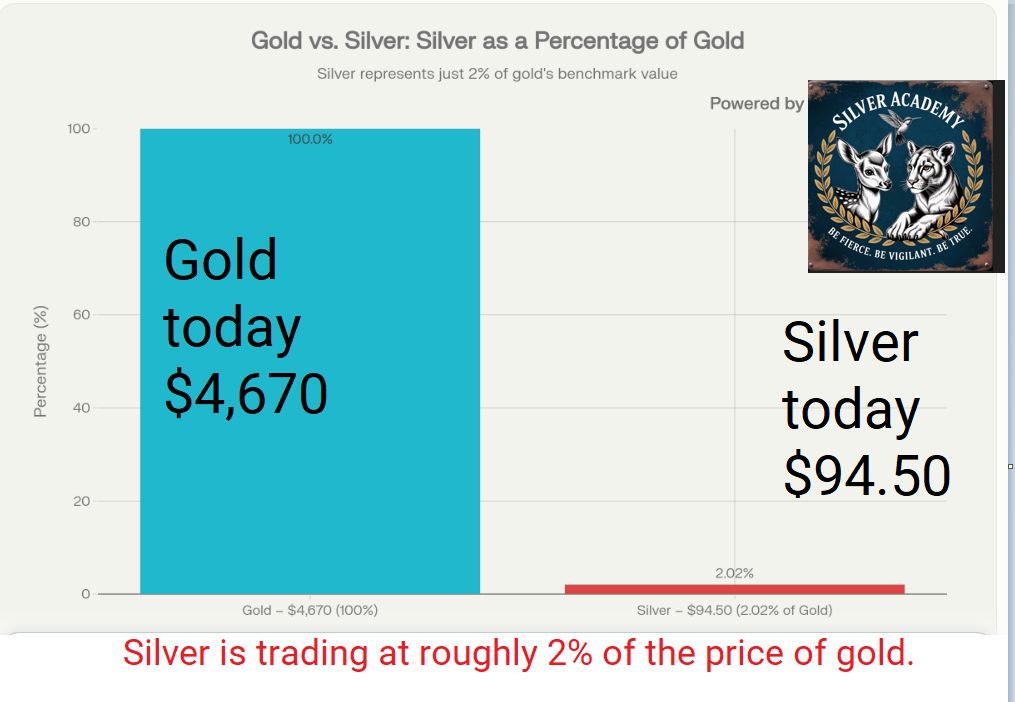
Oliver highlighted that investors were missing the real story — the silver-to-gold ratio. Early last year, silver was just 1% of the price of gold. By spring, it had doubled that share. Historically, major silver peaks corresponded to 3.1% (2011) and even 6.5% (1980). With gold potentially on its way to $8,000, a 3%–6% ratio implies silver between $240 and $500. That mathematical relationship — not hype — underpins Oliver’s “couple hundreds” forecast. Oliver calculates silver as a percentage of gold, rather than using the customary gold-to-silver ratio. For example, he divides today’s silver price of 94.50 by gold’s price of 4,670, which equals approximately 0.0202, or 2.02%
Breaking the $95 Illusion
Most traders think in linear price terms: $4 to $50 looks like a $45 spread, so they project another $45 higher and expect silver to stall around $95–$100. Oliver insists that’s the wrong lens. On a log scale, the move from $4 to $50 is more than a tenfold gain. Applying the same ratio to a breakout above $50 implies a target closer to $500. What looks “impossible” today simply lacks historical perspective — nearly identical magnitude moves have already happened twice in modern history.
The Macro Powder Keg
What could light the fuse? Oliver points to systemic cracks in the government bond market. The 30-year U.S. Treasury, he notes, has hovered near historically weak levels since 2022. A break toward 111 on futures could trigger a full-fledged debt-market panic, causing investors to flee into real assets. That’s not a normal recessionary cycle — it’s a structural confidence crisis in sovereign debt.
Meanwhile, M2 money supply continues to balloon parabolically, undermining CPI-based arguments that metals are “overbought.” The currency unit itself, Oliver stresses, is the problem. Investors who think their assets have doubled in nominal terms may eventually discover they’ve stood still in real purchasing power.
The Repricing Moment
Silver’s half-century of suppression — whether by speculative inertia or deliberate intervention — has built energy like a compressed spring. When that restraint breaks, markets don’t simply normalize; they overcorrect. We’ve seen this dynamic before in copper, which quadrupled once it escaped its long-held $1.50 ceiling in 2005, and in lead, which did the same in 2007.
The coming revaluation of silver isn’t a blow-off top — it’s the market catching up to five decades of monetary distortion. The $500 target may sound extravagant. But from a structural and historical perspective, it’s simply symmetry — the third act of a recurring pattern.
And the message for investors watching from the sidelines? If Michael Oliver’s read is right, we’re still extremely early in a move that will redefine what “overbought” even means.
-
Michael Oliver directs readers to OliverMSA.com.
-
The site explains his Momentum Structural Analysis (MSA) methodology.
-
Visitors can access sample reports and learn how MSA identifies momentum-based breakouts before price moves.
end of segment
-
Not financial advice
-
Our opinions are not our sponsors
-
The editorial department is separate from the promotions department