
by Jon Little intern Niko Moretti
The Silent Tsunami: Why Silver’s Moment Is Coming as US M2 Explodes to $22 Trillion
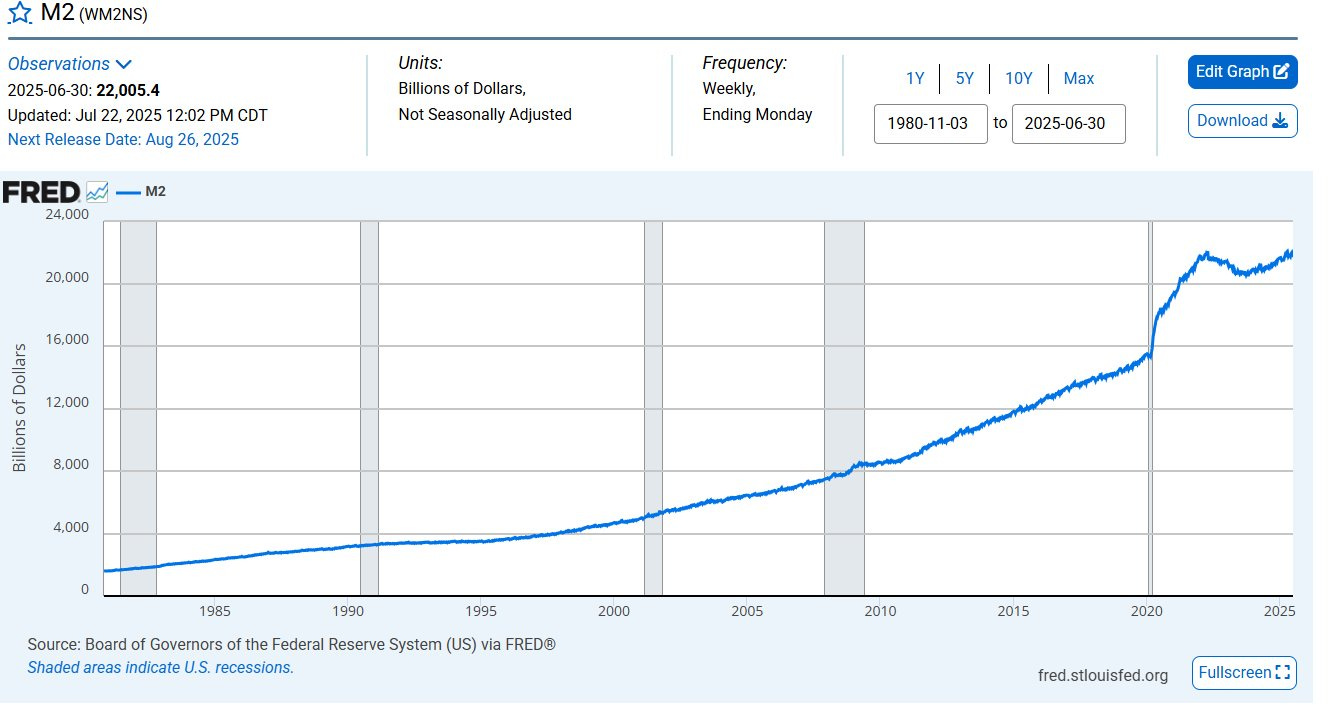
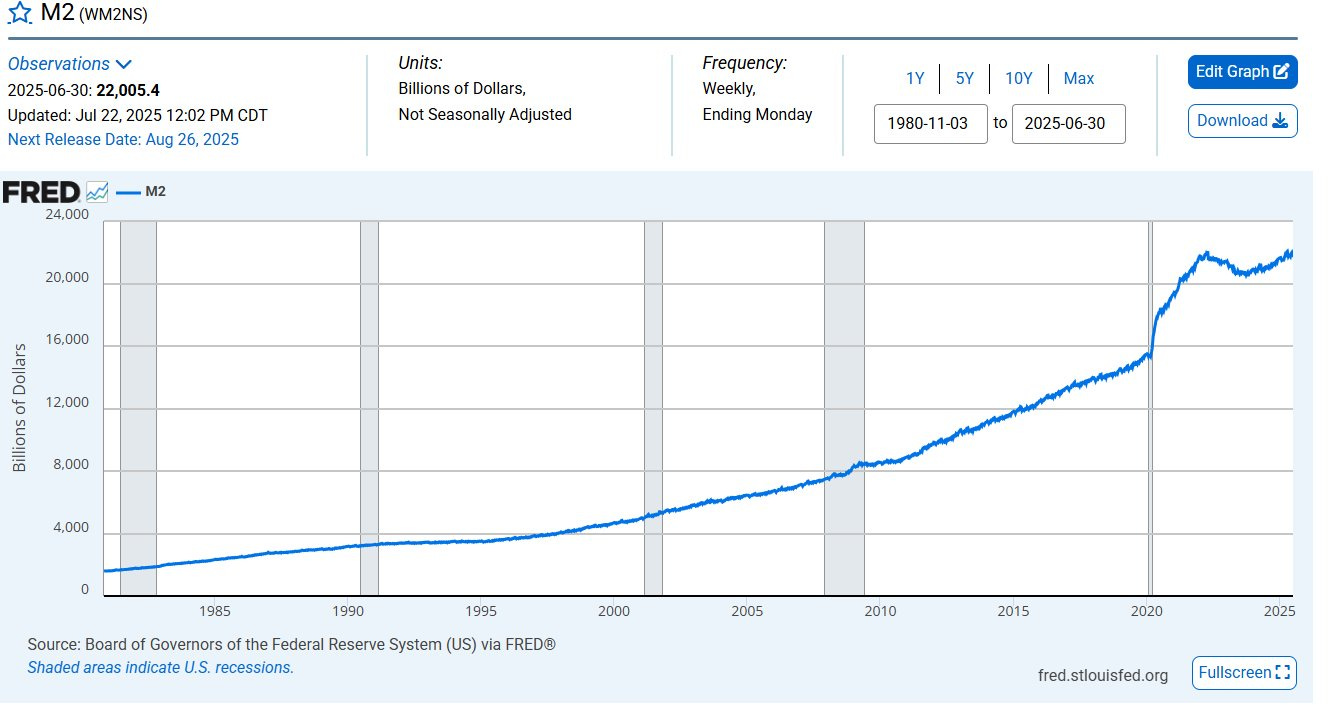
It’s not just another number buried in a Fed spreadsheet. The US M2 money supply has thundered past $22.02 trillion—an ALL-TIME HIGH that eclipses the COVID stimulus flood, roaring well beyond pandemic levels and shattering previous records. The financial press is sleepwalking through this story—no alarm bells, no flashing headlines. But for anyone interested in hard assets, this is the signal to sit up, pay close attention, and get ready for the kind of market action that turns silver bugs into silver lions.
What Is M2—And Why Should You Care?
M2 is more than a financial acronym—it’s cash, checking deposits, savings accounts, money market funds, and short-term deposits all mashed together. It’s the broadest measure of liquidity sloshing through the veins of the US economy. When M2 surges, it multiplies the dollars chasing everything from groceries to gold to stocks.
And when it surges this hard, history tells us to brace for inflation and asset rallies. More money. Chasing fewer goods and real assets.
The Debt Double Whammy: Currency Debasement in Plain Sight
Here’s what makes this moment explosive. The US government is adding $1.87 trillion in new debt over the past year—that’s roughly $1 trillion every 196 days, and projections continue to show increases at breakneck speed. Not only are rates projected to fall (Fed says cuts could come as soon as September 2024), but both debt and money supply are accelerating hand-in-hand.
Simply put: The more dollars in circulation and the more debt created, the less each dollar is worth. Currency debasement is happening in slow motion.
Why Most Investors Miss the Real Risk
You may have heard that M2 dipped in 2022-2023—the first decline in decades. So, what changed? The dip is over. The liquidity wave is building, and the “tightening phase” is officially yesterday’s news. Now, we’re facing the opposite: more liquidity, more inflation risk, and the kind of economic environment where hard assets like silver shine brightest.
The Historical Pattern
Gold loves this setup. But here’s the twist that CNBC forgot: When inflation hits, silver repeatedly outperforms gold. During the 1970s stagflation crisis, silver rocketed upwards by 1,546%—outdoing even gold’s legendary run. More recently, from the COVID lows in March 2020, silver surged nearly 70% in just 14 months—blowing gold’s comparatively modest gains out of the water.
Why does silver slingshot past gold during these surges?
-
Smaller, more volatile market: It takes less liquidity to move silver’s price.
-
Dual demand: Silver is coveted not just as money, but as an industrial metal—used in solar panels, electric vehicles, electronics, and medical tech.
-
Tight supplies: Above-ground inventories are thin, and mining output creeps up at a glacial 1–2% annually. Much industrial silver is non-recyclable, so mined ounces disappear into products forever.
The Setup Right Now Is Electric
Big liquidity inflows + relentless industrial demand = serious supply squeeze risk. The latest COT (Commitment of Traders) data shows heavy shorting in the silver market, holding back prices. But when liquidity floods in, that lid can crack fast, sending silver’s price screaming higher—often doubling percentage gains of gold.
Timing? We’ve entered the seasonally strong period for metals (August–September), with M2 at record levels, geopolitical instability in the headlines, and central banks hoarding gold like never before. All the classic signals for an explosive silver rally are flashing red-hot.
The Conclusion: Silver Is More Than A Commodity—It’s An Escape Hatch
Here’s the bottom line: When M2 money supply hits record highs, it’s not just a statistic. It’s a siren. It means more dollars competing for fewer real assets. In a world drowning in debt and hyper-liquidity, silver isn’t just a speculative play. It’s insurance, a potential escape hatch from the side effects of unchecked money printing.
Silver stackers take note: The combination of monetary expansion, industrial demand, and supply tightness is forming the most powerful setup we’ve seen in years.
Don’t let the quiet on CNBC, Bloomberg and Forbes lull you into complacency. This is how the next hard asset bull markets begin—and silver is primed for the spotlight.
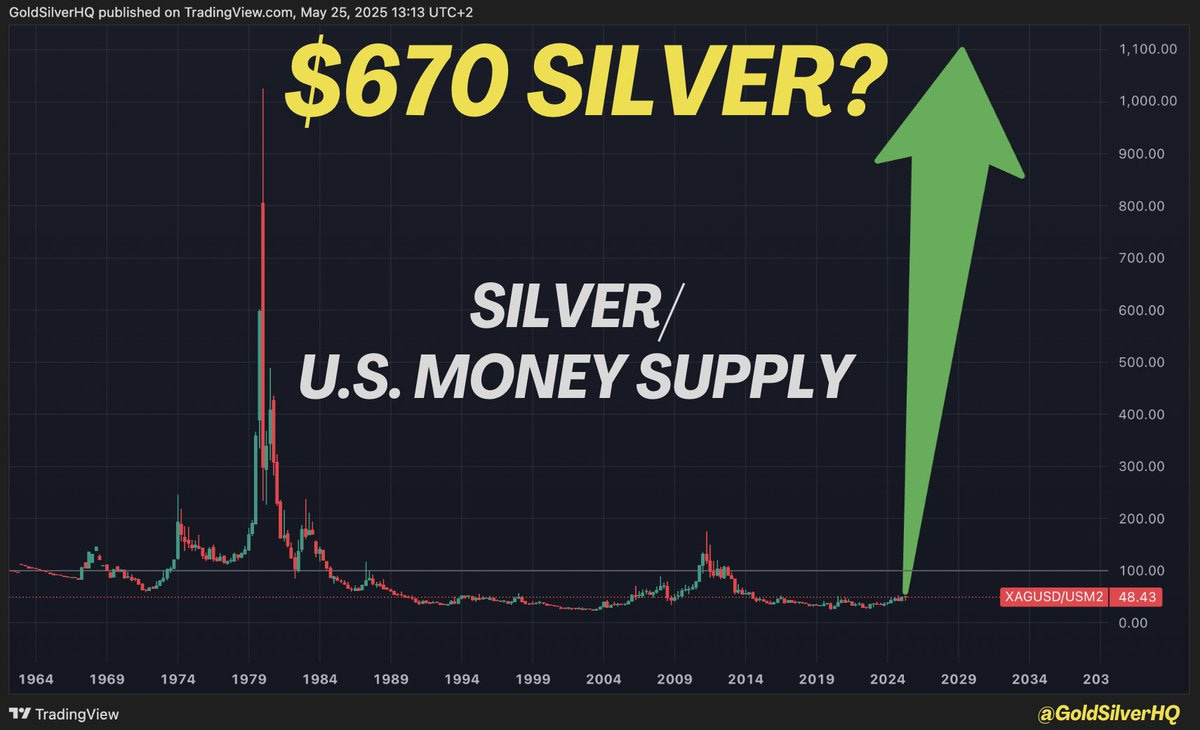
The silver/M2 ratio on that chart is about 50. It was 1000 in 1980. So 20x. 20x $33.5 = $670. It’s a bit outdated, now that silver is $38. need to update it…