
Silver is signaling an historic repricing event that could drive prices toward the $300 per ounce zone by 2026, right in line with Bank of America’s upper‑end $309 target for the metal. Two interlocking technical breakouts now argue that silver’s move from a multi‑decade trading box into a completely new price reality is already underway.
Bank of America joins the $300 camp
Bank of America’s head of metals research, Michael Widmer, now projects silver could trade anywhere between roughly $135 and $309 per ounce before the end of 2026, anchoring both targets in gold‑to‑silver ratio math rather than blue‑sky hype. Using gold near the $5,000 area, the bank maps a “moderate” scenario based on the 2011 ratio low around 32:1 and an “extreme” scenario using the 1980 blow‑off ratio near 14–15:1, which is what drives the $300‑plus silver case. This framework effectively mainstreams the long‑standing thesis of a violent, ratio‑driven revaluation in silver that independent bullion investors such as Eric Sprott have argued for years, including the potential for a return to a 15‑to‑1 band and triple‑digit silver pricing as monetary stress collides with scarce physical supply.
Breakout one: gold vs S&P 500
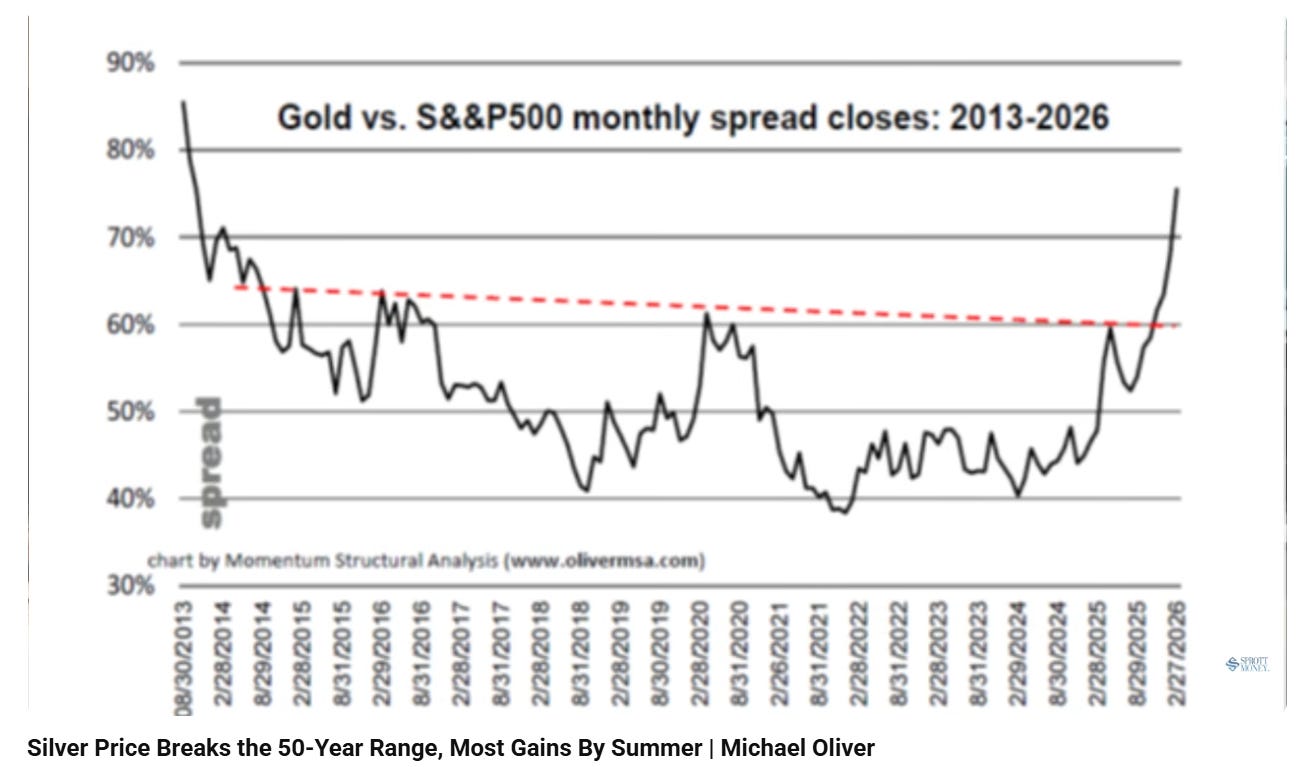
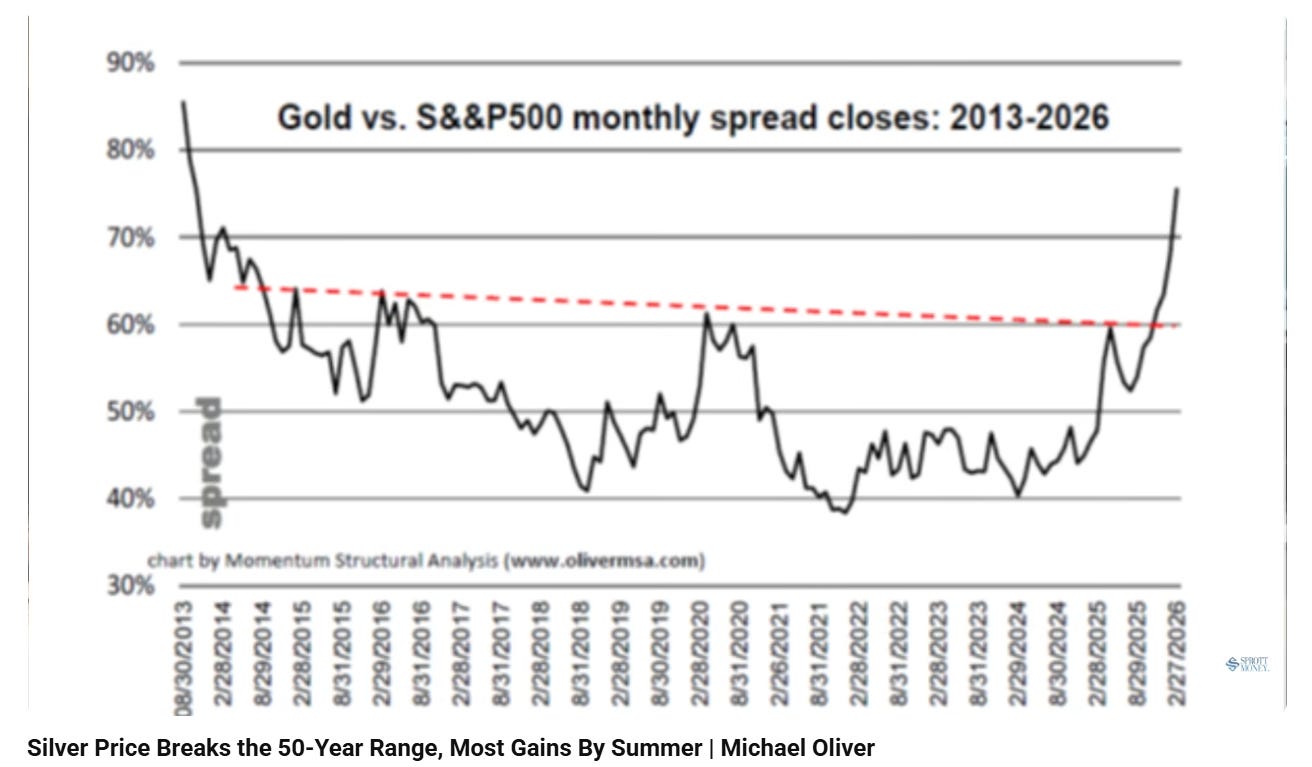
The first key breakout is gold’s decisive outperformance versus the S&P 500, which has quietly flipped the global asset‑allocation script. On a long‑term relative‑performance chart plotting gold as a percentage of the S&P 500, the ratio spent roughly a decade bumping against a downward‑sloping ceiling that began after gold’s 2011 peak, reflecting a long era in which equities structurally beat monetary metal. That ceiling finally gave way late last year: by November, gold had punched through a 10‑plus‑year resistance line on the monthly closes, and over the next three months gold added roughly $1,000 while the S&P 500 went essentially sideways, a textbook spread breakout where the “winner” asset surges rather than merely edging ahead.
This matters because gold’s breakout versus the S&P 500 is exactly the kind of structural rotation signal that precedes major, trend‑defining bull markets in monetary metals. In prior cycles, similar ratio breakouts have preceded not just continued outperformance, but vertical acceleration as capital abandons over‑owned financial assets for under‑owned real money, and the early 2026 tape already shows gold handily “crushing” the S&P 500 on recent three‑year and year‑to‑date comparisons
Breakout two: silver vs gold spread
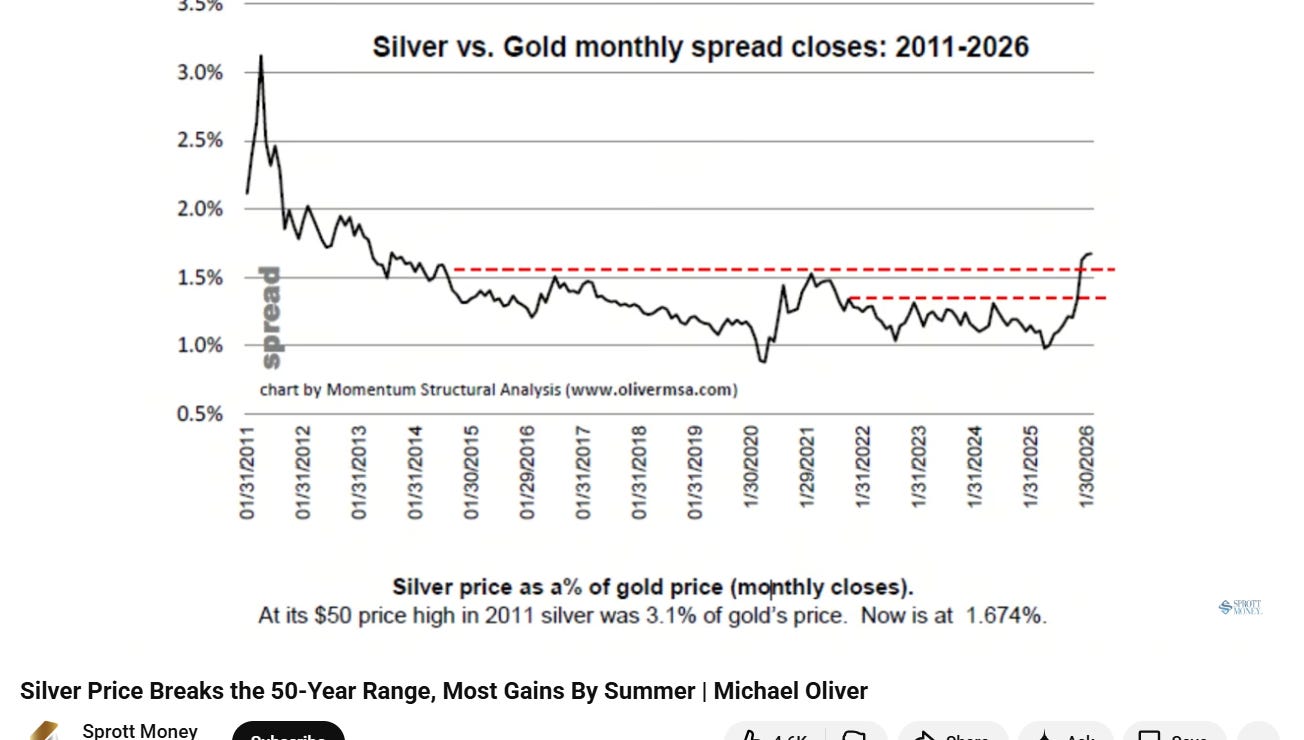
The second, and for silver investors more important, breakout is the silver‑versus‑gold spread itself. Instead of looking at a crude ratio, momentum technicians track silver as a percentage of gold and identify long, clean base structures where silver oscillates between “cheap” and “expensive” bands relative to the yellow metal. In 2011, when silver last hit the $50 level, that spread peaked near roughly 3.1 percent – meaning silver traded a little over 3 percent of the gold price before collapsing with the end of that cycle’s mania. During the subsequent bear and paper‑suppression era, the spread was smashed to below 1 percent at extremes, telegraphing historic under‑valuation in silver against gold that echoed how bombed‑out gold and silver miners became versus bullion itself.
That multi‑year compression has now snapped. By late 2025 and into early 2026, the silver‑versus‑gold spread pushed through the first major breakout band on long‑term charts, with technicians flagging the November monthly close as the formal launch point. At that initial breakout level, silver was still in the mid‑$50s; within just a few months the price had ripped into the high‑$80s and then beyond $120 in a spike, even after a violent correction back toward the $80 area. Crucially, the spread itself has continued to make higher highs, a classic tell that silver’s leadership over gold is only in the early innings and that the real “gusher” phase tends to arrive within a couple of quarters of such a clean break
Why $300 silver by 2026 is coherent, not crazy
Once a market finally escapes a half‑century price box, orthodox “measured move” targets based on the width of the old range quickly become obsolete, as copper and lead both demonstrated when they exploded from multi‑decade ranges into entirely new price regimes in the 2000s. Silver spent roughly fifty years oscillating between about $4 and $50, and when it finally punched decisively through that ceiling, the first impulse carried it more than the classical range‑projection would suggest, signaling that the market was rejecting the old gravity and searching for a much higher equilibrium. Layer on top of that the monetary degradation since 1980 and 2011 – with M2 and broad credit creation massively debasing the dollar – and both independent analysts and large banks now argue that simply inflation‑adjusting those old peaks already places “fair value” silver in the mid‑hundreds before any speculative overshoot.
Bank of America’s $135–$309 band effectively formalizes that arithmetic, using historical ratio compression to 32:1 and 14–15:1 respectively, and is fully consistent with bullish frameworks that put gold in the $6,000–$8,000 zone and silver back toward 3–7 percent of the gold price as the cycle matures. At a 15‑to‑1 ratio – roughly 6.7–7 percent of the gold price – and gold between about $4,500 and $8,000, you are naturally funneled into a $300–$400 silver range, right where both Eric Sprott’s long‑standing thesis and Bank of America’s new 2026 ceiling converge.
Compression, failed control, and vertical repricing
The repeated “glitches” and trading interruptions in silver, gold, and even natural gas over the past year are best understood as compression events within an over‑leveraged, derivative‑dominated system, not as signs that the market can be held down indefinitely. Each effort to restrain physical reality through futures limits, outages, or margin shocks merely shoves genuine price discovery further into the future, increasing the pressure that must eventually be released once confidence in the old pricing scheme cracks. History shows that when such artificially compressed markets finally regain control from their paper overlays, they do not glide gently toward fair value; they gap, with multi‑percentage‑point daily moves and strings of double‑digit gains as the tape seeks a new reality.
In silver’s case, that new reality now points directly at the $300 zone by 2026, backed by a major Wall Street bank’s published framework, a clean breakout of gold versus the S&P 500, and a powerful, still‑young spread breakout in silver versus gold that has only just begun to do its work. For investors, the message from these structural shifts is straightforward: this isn’t about nickels and dimes anymore – the monetary metals complex is re‑rating, and silver is positioned to be its most explosive expression.
end of segment
-
our opinions are not our sponsors opinions
-
the editorial department is separate from the promotions department
-
not financial advice